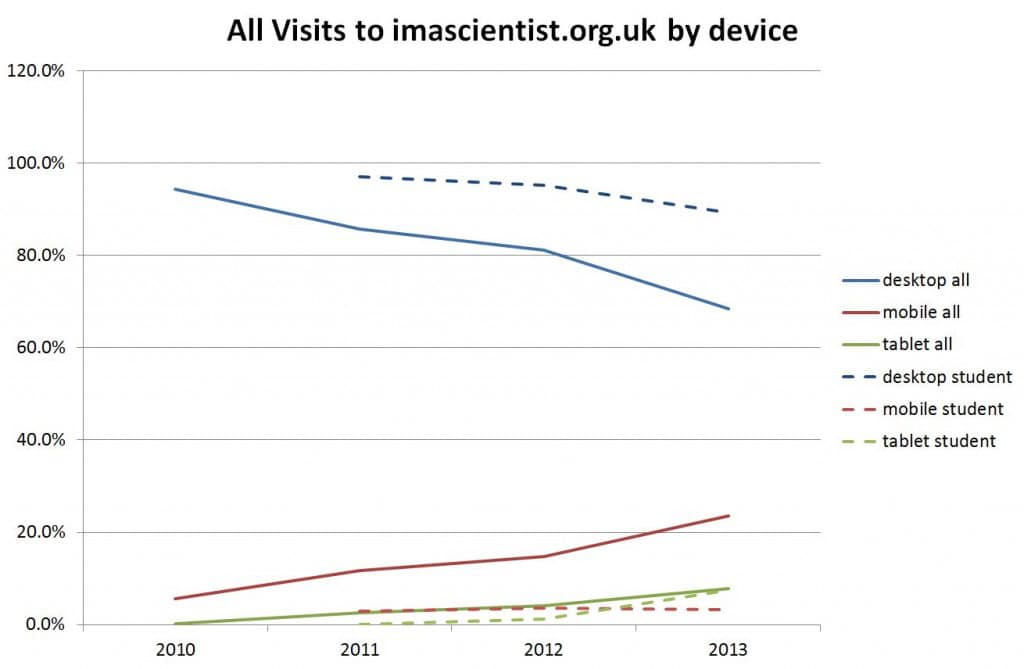
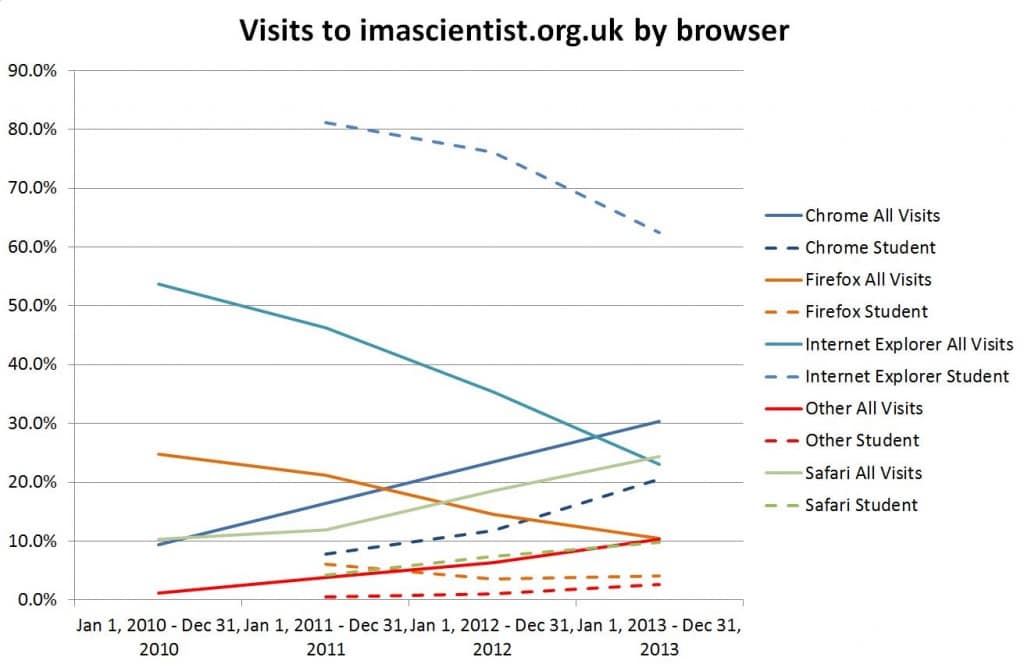
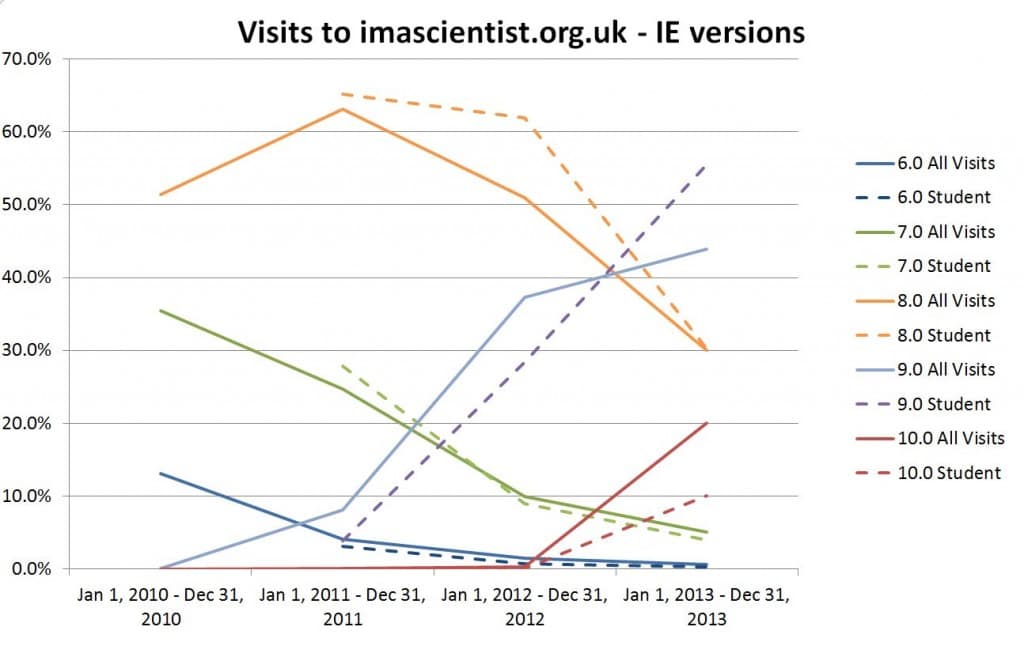
In 2014, as part of a review of what we need to do over the next 5 years with I’m a Scientist, we looked at how visitors accessed the site and how that has changed year by year over the last 4 years. We also looked at how visitors registered as students differed from All visitors. The Student visitors probably give a fair reflection of school IT capabilities. In the graphs the student data is represented by dashed lines. We only have student data from 2011 when we started tracking registered users separately. View more data up to 2019, 2018, 2015.

It was no surprise to see that visits from mobile and tablet devices were increasing but having 23.6% of visits from mobile devices in 2013 was a shock. Delving deeper it is clear that it is mostly questions that mobile users visit. Tablets tell a different story. For student tablet users there is little difference in content visited when compared to student desktop users. And it is interesting to see that the levels of tablet use are the same for students as for all users at just under 8%.
We need to adapt our design for the question page so mobile users get a better experience.
We also need to be more aware of how easy it is for registered tablet user to interact with the site.

Browser usage tells an interesting story. Unsurprisingly Internet Explorer is plunging. But at over 60% it is still the most popular browser in schools. More surprising was the drop in usage of Firefox. The rise in other browser is mostly due to mobile and tablet browsers with Android, Blackberry and Opera featuring.

Finally the web developers enemy – old versions of IE. IE6 has just about disappeared. Yay. IE7 hangs on at 4%, but IE8 remains popular. The surprise for us in this graph was that All visits and Student Visits differed little in respect of IE version.
If you have any questions or would like more data. Please let us know in the comments or via email.
Recent Comments
No comments to display